
Virginia Beach Jail Average Daily Population
The core measure of a jail population is the average daily population, or ADP. It smooths the daily swings into a single yearly figure. The Sheriff's Office reported an ADP of 1,010 in its FY2025 annual report, up slightly from 996 in the FY2024 report. That is a small rise of about 14 people on an average day, and it keeps the jail close to the 1,000 mark across both years.
ADP is not a head count for any single day. A jail of this size will hold more on some days and fewer on others, as bookings and releases move people in and out. The yearly average is the figure to compare across reports, and it is the number the state collects for its own jail reporting. The two recent VBSO figures sit just under and just over 1,000, which points to a stable population rather than a sharp swing.
The Sheriff's Office reports a wide set of operations data alongside the ADP. The table below pulls the headline figures from the FY2025 annual report, with the FY2024 ADP shown for comparison. All figures come from official VBSO reporting.
| Measure | Figure | Source |
|---|---|---|
| Average Daily Population (FY2025) | 1,010 | VBSO Annual Report 2025 |
| Average Daily Population (FY2024) | 996 | VBSO FY2024 Annual Report |
| Total personnel | 486 | VBSO Annual Report 2025 |
| Uniformed personnel | 379 | VBSO Annual Report 2025 |
| Civilian personnel | 107 | VBSO Annual Report 2025 |
| Civil process documents served | 146,075 | VBSO Annual Report 2025 |
| Training hours | 7,301 | VBSO Annual Report 2025 |
These figures show that the jail is one piece of a larger agency. The same office that holds the inmate population also serves court papers and secures the courthouse, which is why the staffing total covers far more than jail floor work.
Virginia Beach Jail Staffing Behind the Population
Population data reads better next to staffing data. The Sheriff's Office reported 486 total personnel in FY2025, split into 379 uniformed staff and 107 civilians. Against an ADP near 1,010, that puts a sizable workforce behind each day's count. Uniformed staff cover custody, security, and civil process; civilians cover records, accounting, and support roles.
The workload reaches well past the cell blocks. The office served 146,075 civil process documents in FY2025, a heavy paper load that the same staff carry alongside jail duties. Training also takes real time, with 7,301 training hours logged in the year. The agency notes recent gains such as new body-worn cameras and staff pay raises of 10 to 18 percent, which it ties to keeping the workforce stable. A stable workforce matters when the population holds near 1,000 day after day.
Mental Health in the Virginia Beach Jail Population
Behavioral health is a defining feature of the modern jail population, and the Sheriff's Office reports hard numbers on it. The office screened 2,111 inmates in FY2025. Of those screened, 74 percent had at least one mood, psychotic, anxiety, substance-use, or trauma disorder. That single figure reframes the jail less as a holding space and more as a place where most screened people carry a diagnosable condition.
The diagnosis breakdown sits in the table below. The categories can overlap, since the report also found that 51 percent had co-occurring conditions, so the rows do not sum to 100 percent. These figures describe the screened group, not every inmate in the jail. All numbers come from the FY2025 VBSO annual report.
| Condition (among screened inmates) | Share |
|---|---|
| At least one disorder | 74% |
| Mood disorders | 40% |
| Substance use disorders | 41% |
| Co-occurring conditions | 51% |
| Psychotic disorders | 10% |
| Trauma disorders | 6% |
| Anxiety disorders | 1% |
The report adds context around the screened group. It found 78 percent had been incarcerated before, 54 percent had prior behavioral-health treatment, 8 percent were homeless, and 93 percent had natural supports such as family. The report also notes that 100 percent of the screened group held some form of insurance. Those figures help explain why reentry planning is built into the jail's work. The earlier estimates were rougher: the office once put mental illness at 35 percent of the population, while the local Community Services Board estimated 10 percent, which is why the screening program now drives the count.
The gap between those old estimates and the screening result is the real story in the data. A 35 percent guess and a 10 percent guess sit far apart, and neither matched what the screening found. By testing 2,111 people and recording each result, the office replaced a guess with a measured figure. That is why a population page leans on the screening data rather than the older estimates, even when the older numbers are easier to state in a single line.
Service Engagement Within the Population
Screening is only the first step. Of the screened inmates, 1,562 met the criteria for behavioral-health services. Engagement, though, ran low. The report says 1,086 of that group refused services, 90 fully enrolled, and 386 received monitoring or support. Those splits show that meeting the need is harder than measuring it.
Timing is part of the problem. The report notes that 549 inmates were released before they finished the behavioral-health admissions process, which cuts a planned handoff short. For the smaller group that was discharged after treatment, the outcomes were strong: 78 percent left with housing in place, 100 percent had an adequate medication supply, 72 percent engaged in outpatient appointments, and 98 percent did not return to jail after reentering the community. The office also runs a medication-assisted treatment program for opioid use disorder, with 19 clients enrolled in the reported year.
Note: The screening percentages describe inmates who were screened or who met service criteria, not the entire jail population on any given day.
Programs That Shape the Virginia Beach Jail Population
The daily count is not just a function of arrests. Alternative-sentencing programs move some people out of the cell blocks while they still serve a sentence, which holds down the in-house population. The Sheriff's Office runs several such programs, each with its own rules and its own daily fee that the participant pays.
Two home and work programs anchor the set. The On-Site Unit and the Electronic Home Incarceration Program both require 12 months or less left on an active sentence, and both can start by Inmate Request Form or by court order. The On-Site Unit costs $5 per day plus a $50 processing fee. The Electronic Home Incarceration Program costs $10 per day plus a $50 processing fee, bars violent or sex offenses, and requires employment and monitoring equipment at home. A separate Weekender Program lets people serve jail time on nonconsecutive days to keep a job or family duties; the FY2024 report counted 2,528 Weekender participants.
These programs explain part of the gap between how many people are sentenced to the jail and how many sit inside it on an average day. A participant on home monitoring counts against a sentence without filling a bed. That is one reason an ADP figure should be read as the in-house average, not the total of everyone under the jail's authority.
Oversight of the Virginia Beach Jail Population
A jail population sits under several layers of oversight, and the agency reports on that too. The Sheriff's Office Professional Standards unit logged 403 cases between July 1, 2024 and June 30, 2025. That total broke down into 63 citizen complaints, 104 inmate complaints, 97 personnel conduct reports, 120 inquiries, 19 safety inquiries, and zero EEO complaints.
In-custody deaths follow a set path. The report states that the Virginia Beach Police Department investigates in-custody deaths at the jail, and that deaths are reported to the Virginia Department of Corrections, which also has authority to investigate. That outside review is a structural check on how the population is held. Complaint and death-review data, read together, give a fuller picture than a raw head count ever could.
Virginia Beach Jail Population in Statewide Context
A local number means more next to the state figure. The Virginia Compensation Board's FY2023 Jail Cost Report put the statewide local and regional jail ADP at 19,620, down 9.8 percent from the prior year. The same report set the average total operating cost at $145.18 per inmate per day. Against that backdrop, a Virginia Beach ADP near 1,010 is a meaningful share of a single locality's load within a declining statewide trend.
The comparison comes with a caveat on timing. The statewide figure is FY2023, while the local ADP figures are FY2024 and FY2025, so they do not line up to the same year. Statewide reporting also describes a dip in local-responsible jail populations during FY2020 through FY2022, followed by a rise in FY2023 and FY2024. For Virginia Beach alone, the two confirmed years sit near 1,000, so a longer multi-year local trend should not be claimed without pulling earlier VBSO reports. For the state prison side and broader counts, the Virginia Department of Corrections keeps its population reports.
To set the local figures in a statewide frame, the VADOC population reports page gathers prison and supervision counts across Virginia.
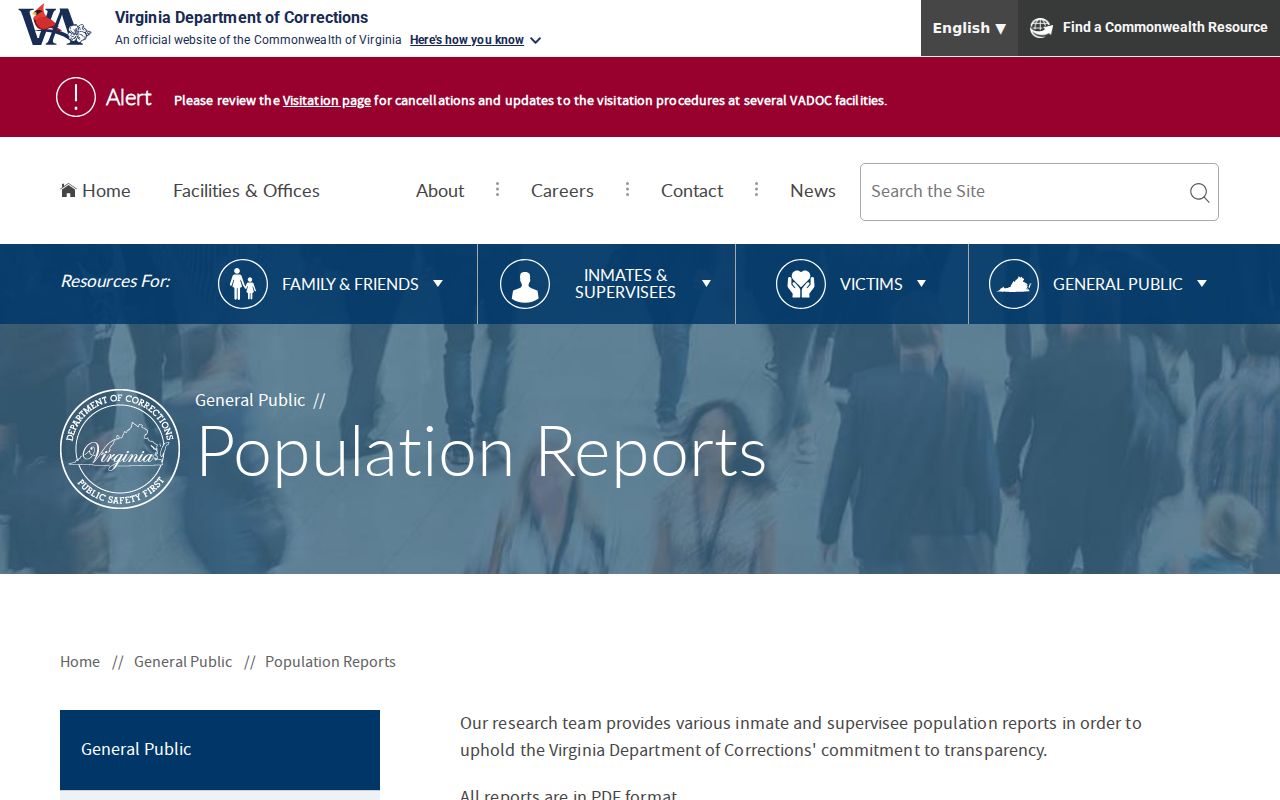
Pairing the state reports with the VBSO annual figures shows where a Virginia Beach jail population near 1,000 sits in the larger trend.
Virginia Beach Jail Capacity and the Data Gap
One figure is missing on purpose. An official design capacity, or rated bed count, for the Virginia Beach Correctional Center was not found in the official Sheriff's Office materials reviewed. Because of that, no capacity number is stated here, and an ADP near 1,010 should not be read as a percentage of any assumed capacity. Stating a bed count without a source would be a guess, and a guess does not belong in a data page.
The right place to confirm capacity is the state oversight body. The Virginia Board of Local and Regional Jails publishes a Jail Capacity Report, and that report is the official source for a rated capacity figure. Anyone who needs the capacity number should pull it from that report rather than from a roster or an annual report, since the annual report covers population and operations but not a rated bed count. Until that source confirms a number, the capacity figure remains an open gap, clearly marked as such.
Reading Virginia Beach Jail Population Trends
A trend needs more than two points, and the local record here is short. The confirmed Virginia Beach ADP figures cover FY2024 at 996 and FY2025 at 1,010, a rise of about 1.4 percent. That is a slight increase, not a surge, and it should be described that way. Claiming a five-year local trend would overreach, since the earlier VBSO annual reports were not tabulated in this review.
The statewide picture gives a frame for that local move. State reporting describes local-responsible jail populations falling during FY2020 through FY2022, then rising in FY2023 and FY2024. The two recent Virginia Beach figures fit the later, rising part of that pattern, but they cannot stand in for a full local series. For a careful read, the honest takeaway is narrow: the Virginia Beach jail population held near 1,000 across the two most recent reported years, with a small uptick. Anyone needing a longer local trend should pull the FY2021 through FY2023 VBSO annual reports and tabulate the ADP from each one.
Note: The local population data shows a small rise between FY2024 and FY2025, but a longer multi-year trend is not supported without earlier annual reports.
Looking Up a Single Virginia Beach Inmate by Name
Population data answers how many, not who. For a single person, the count is the wrong tool. Name and identifier lookups run through the jail roster instead, which the inmate records page covers in full, and a release check runs through the released inmates page. Those pages handle the search; the figures above handle the trends.